Differential Tibial Slope Ratio-A New Risk Factor for ACL Injury
Surekh Ravi*
Department of Experimental Medicine, University of Toronto, Ontario, Canada
Published Date: 2025-06-18DOI10.36648/2471-8416.11.2.253
Surekh Ravi*
Department of Experimental Medicine, University of Toronto, Ontario, Canada
- *Corresponding Author:
- Surekh Ravi Department of Experimental Medicine, University of Toronto, Ontario, Canada E-mail:surekh.ravi@gmail.com
Received date: November 26, 2024, Manuscript No. IPJCEOP-26-19973; Editor assigned date: November 29, 2024, PreQC No. IPJCEOP-26-19973 (PQ); Reviewed date: December 16, 2024, QC No. IPJCEOP-26-19973; Revised date: June 11, 2025, Manuscript No. IPJCEOP-26-19973 (R); Published date: June 18, 2025, DOI: 10.36648/2471-8416.11.2.253
Citation: Ravi S (2025) Differential Tibial Slope Ratio–A New Risk Factor for ACL Injury. J Clin Exp Orthopr Vol:11 No:2
Abstract
Objective: One of the most often researched modifiable risk factors for ACL damage is an increased posterior tibial slope. One important risk factor that has already been identified is an elevated lateral tibial slope. We believe that an internal torque that puts more strain on the ACL could be caused by the discrepancy in the medial and lateral tibial slopes. If so, one of the main risk factors for ACL injury should be the differential tibial slope ratio as measured here. ACL screening programs and individually tailored rehabilitation following reconstruction procedures will benefit from a better understanding of the distinction between the medial and lateral tibial slopes and how they affect ACL injury. We examined the relationship between ACL injury and the medial and lateral posterior tibial slopes as well as the differential tibial slope ratio. To the best of our knowledge, there are no publications up to date looking at differential tibial slope ratio in ACL injury.
Methods: An MRI-based measurement was taken by an already described method in the literature. After analysing the medial and lateral tibial slopes, the differential tibial slope ratio was computed.
Results: Patients with ACL injuries had significantly higher medial and lateral tibial slopes as well as a higher differential slope ratio. Of the measured values, the differential tibial slope was the least significant and the lateral tibial slope was the most significant.
Conclusion: When comparing the medial tibial slope and differential tibial slope ratio, the lateral tibial slope is the most significant of the three measured values.
Keywords
ACL injury; Medial tibial slope; Lateral tibial slope; Posterior tibial slope; Differential tibial slope
Introduction
Globally, the prevalence of Anterior Cruciate Ligament (ACL) injuries is continuously rising [1,2]. The research has discovered and documented a number of risk variables that predispose people to ACL injury. Environmental, anatomical, hormonal, and neuromuscular are the four groups into which these have been separated. Anatomic, hormonal and sex-based traits are nonmodifiable risk factors that are often inherited to an individual. Neuromuscular control patterns, gross biomechanical movement patterns and environmental factors are modifiable risk factors.
The Posterior Tibial Slope (PTS), notch morphology, and femoral notch breadth height are examples of anatomical risk factors. More research has been done on the PTS's impact, with wildly differing findings. The degree of PTS may be a crucial element in knee stability, according to biomechanical studies of the knee. Tibial shear force is a significant determinant of the force transmitted to the cruciate ligaments of the knee.
The external load resulting from the ground response force, knee muscle activity, and the contact force between the femur and tibia are the three main sources of the resulting force. The axial loading on tibiofemoral contact area induces an anteriorly directed shear force on the tibia, caused by the posterior slope of the tibial plateau in the sagittal plane. An increased PTS along with a compressive load will generate an anterior shear component on the tibiofemoral reaction force. This causes an increased anterior translation of tibia relative to femur. Because the ACL is the primary restraint against this type of motion in the knee and increase in PTS will exert an increased force on the ACL and may result in an ACL injury (Figure 1).
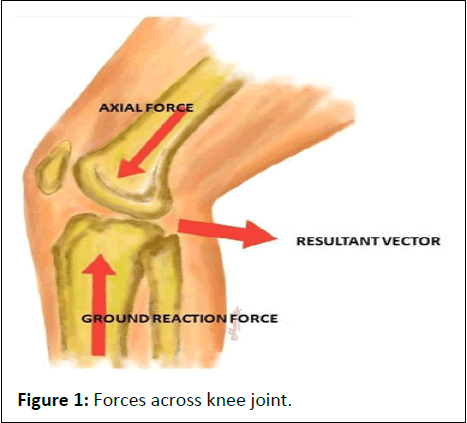
Figure 1: Forces across knee joint.
We hypothesize that a differential PTS between the medial and lateral tibial condyles will result in an additional internal rotational vector or torque which could also predispose an ACL injury (Figure 2). We looked at the medial and lateral posterior tibial slope and the differential tibial slope ratio in association with ACL injury.
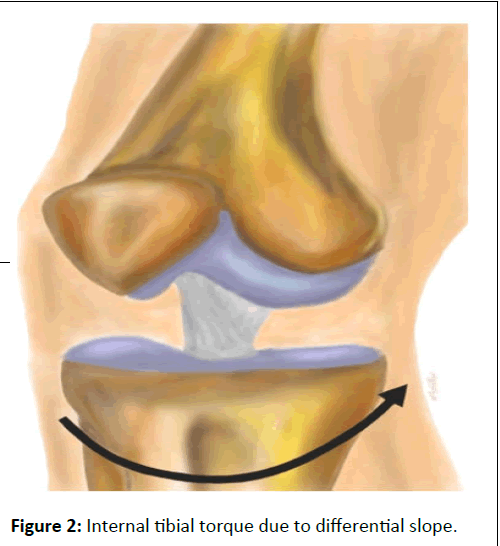
Figure 2: Internal tibial torque due to differential slope.
Materials and Methods
During January 2017 and December 2019, 500 knee MRIs were performed. 190 of them were eliminated due to prior knee surgery and preexisting knee pathology. Magnetic Resonance Imaging (MRI) scans of 310 knees that met the inclusion criteria were chosen. Using a Siemens Magneton Skyra 3 Tesla (Siemens, Erlangen, Germany) scanner, we compared 155 knee MRIs with ACL injuries and 155 without any ACL injuries (control group). Participants who had undergone prior knee surgery were not allowed to participate in the trial.
A difference in the PTS ratios was found after the medial and lateral PTS were measured and reported. The ratio of the lateral to medial tibial slope measurements was used to determine the differential tibial slope.
The following parameters were used to obtain MRIs: T1, sagittal plane, 3 mm slice thickness [3]. The radiologist manually positioned the sagittal MRI slices orthogonal to a line that connected the posterior femoral condyles.
Step 1: The central T1 sagittal image of MRI is selected with intercondylar eminence, tibial attachment of PCL and anterior and posterior tibial cortices in concave shape (Figure 3).
Step 2: In the proximal tibia, place one superior and one inferior circle. The anterior, posterior, and superior tibial inner cortex should all be touched by the upper circle. Both the anterior and posterior tibial inner cortices should be touched by the lower circle. The long axis of the tibia is obtained by joining the centers of these two circles (Figure 3).
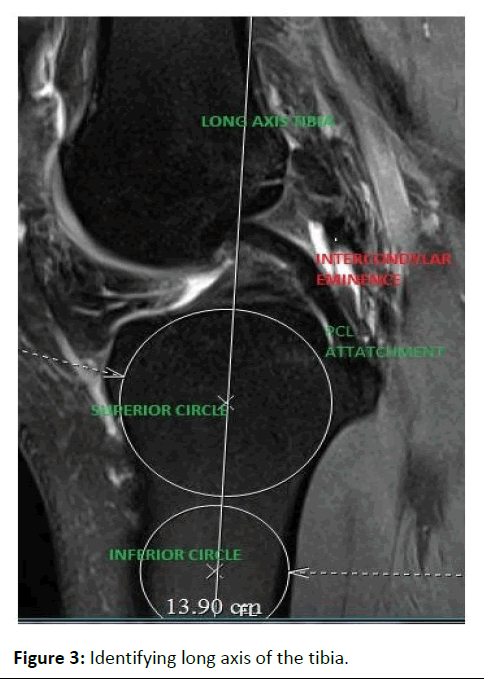
Figure 3: Identifying long axis of the tibia.
Step 3: A straight line connecting the upper most anterior and posterior tibial cortex of medial tibial plateau is drawn. The angle between the orthogonal to the MRI longitudinal axis and the tangent on the medial tibial plateau is defined as medial posterior tibial slope (Figure 4). A similar measurement was done for the lateral tibial plateau (Figure 5).
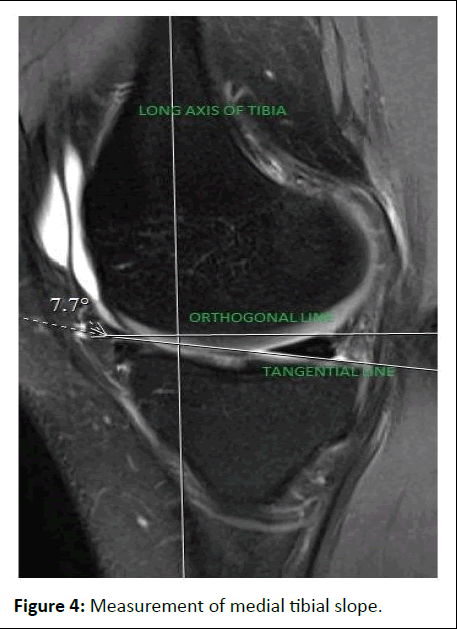
Figure 4: Measurement of medial tibial slope.
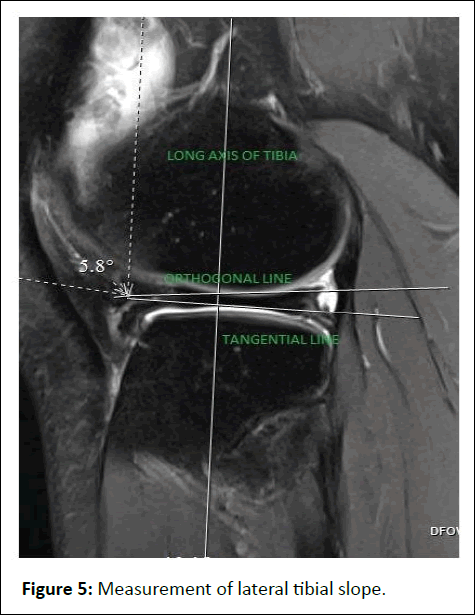
Figure 5: Measurement of lateral tibial slope.
Study design
Cross-sectional single-center study.
Interobserver reliability: All MRIs were measured twice by one orthopedic trainee and one junior consultant working in our department under supervision. The inter observer reliability for this MRI study was 0.96
Statistical analysis
The categorical variables were expressed in frequencies and percentages. Quantitative data were expressed in mean and standard deviation. ROC curve was created to find out the cut-off values for medial and lateral and differential slope ratios in predicting ACL injuries. The Charts and graphs were prepared using Microsoft® Excel version 2019. The geometric mean, range, and SD were calculated using Microsoft® Excel version 2019. Statistical testing of association was done using Students T-test and Pearson correlation. P-value<0.05 was considered statistically significant.
Results
A total of 310 patients were studied among which 218 were males and 92 were females. Out of the 218 males, 135 had an ACL injury and the rest 83 had an intact ACL and in the female study population, 20 out of 92 had an ACL injury (Figure 6) There is a higher incidence of ACL injury among males as compared to females [4].
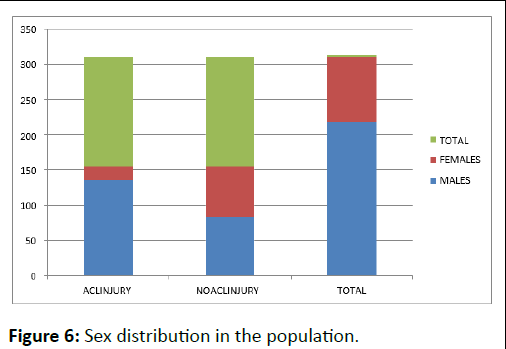
Figure 6: Sex distribution in the population.
The age group ranged from 16 to 59 years with a mean age of 33.5 ± 10.675. 160 (51.6%) right knees and 150 (48.4%) left knees were studied. ACL injury was noted on 81 knees out of 160 right knees and 74 out of 150 left knees (Table 1). Looking at the data, the injury pattern is evenly distributed and is independent of the side involved.
|
|
ACL injury |
No ACL injury |
Total |
|
Right side |
81 |
79 |
160 |
|
Left side |
74 |
75 |
150 |
Table 1: Side of studied knee and injury.
There was a mean medial tibial slope of 7.4 with a standard deviation of 1.15 and a mean lateral tibial slope of 7.9 with a standard deviation of 1.15 among the ACL injured group. Mean medial tibial slope was 5.9 with a standard deviation of 1.06 and mean lateral slope was 6.1 with a standard deviation of 0.96 in the control group. A P value of less than 0.001 indicates that the medial and lateral tibial slopes are statistically significantly higher in the ACL damage group than in the control group.
The ratio of lateral to the medial tibial slope (differential tibial slope) in the ACL injury group was measured to be 1.09 and 1.04 in the control group with a standard deviation of 0.16 and 0.14 respectively. There is a statistically significant increase in differential tibial slope in ACL injured patients as compared to the control group (Table 2).
| ACL/Non ACL | Value | P value | |
| Lateral tibial slope | ACL injury | 7.928 ± 1.15510 | <0.001 |
| Without ACL injury | 6.082 ± 0.96330 | ||
| Medial tibial slope | ACL injury | 7.350 ± 1.15330 | <0.001 |
| Without ACL injury | 5.881 ± 1.06730 | ||
| Differential tibial slope | ACL injury | 1.0919 ± 0.16326 | <0.001 |
| ACL injury without | 1.0478 ± 0.13815 |
Table 2: Lateral and medial tibial slope and differential tibial slope ratio with mean and standard deviation.
A Receiver Operating Characteristic Curve (ROC) curve was obtained to find out potential at-risk values above which ACL injury can occur regarding lateral tibial slope, medial tibial slope, and differential slope ratio (Figure 7). The area under the curve is more for lateral tibial slope, followed by medial tibial slope and differential tibial slope ratio (Table 3).
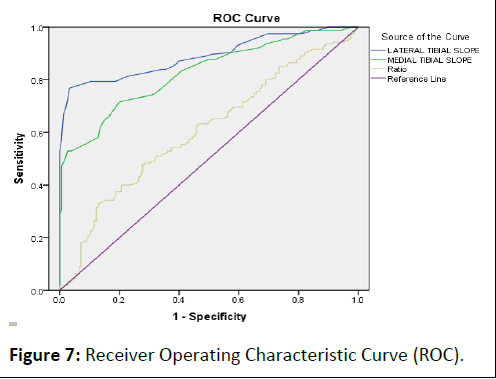
Figure 7: Receiver Operating Characteristic Curve (ROC).
| Test variable | Area | P value | 95% confidence interval | |
| Lower bound | Upper bound | |||
| Lateral tibial slope | 0.89 | <0.001 | 0.852 | 0.927 |
| Medial tibial slope | 0.826 | <0.001 | 0.78 | 0.871 |
| Ratio | 0.606 | 0.001 | 0.543 | 0.668 |
Table 3: Area under the curve for different slopes for ACL injury.
The at-risk value regarding lateral tibial slope was 7.25 with a sensitivity of 76.7% and a specificity of 96.7% (Table 4). The same regarding medial tibial slope is 6.75 with a sensitivity of 71.6% and a specificity of 80% (Table 5). This makes the lateral tibial slope measurement the best predictor in association with ACL injury when all the three values are considered.
| Cut-off scores for lateral tibial slopes for ACL injury | ||
| Score | Sensitivity | Specificity |
| 7.25 | 0.767 | 0.967 |
| 7.35 | 0.722 | 0.974 |
| 7.15 | 0.793 | 0.896 |
Table 4: Cut-off scores for lateral tibial slopes for ACL injury.
| Cut-off scores for medial tibial slopes for ACL injury | ||
| Score | Sensitivity | Specificity |
| 6.75 | 0.716 | 0.8 |
| 7.35 | 0.529 | 0.974 |
| 6.95 | 0.645 | 0.851 |
Table 5: Cut-off scores for medial tibial slopes for ACL injury.
The differential slope ratio at risk value was 1.15 with low sensitivity (32.9%) and a specificity of 87.1% (Table 6).
| Cut-off scores for ratio of tibial slopes for ACL injury | ||
| Score | Sensitivity | Specificity |
| 1.15 | 0.329 | 0.871 |
| 1.12 | 0.477 | 0.722 |
| 1.11 | 0.483 | 0.716 |
Table 6: Cut-off scores for the ratio of tibial slopes for ACL injury.
The mean lateral and medial Tibial slope and the differential tibial slope ratio was found higher in males as compared to females with a statistical significance of P value less than 0.001 (Table 7).
| Sex | N | Value | P-value | |
| Lateral tibial slope | Male | 218 | 7.205 ± 1.4364 | <0.001 |
| Female | 92 | 6.530 ± 1.2192 | ||
| Medial tibial slope | Male | 218 | 6.838 ± 1.2890 | <0.001 |
| Female | 92 | 6.090 ± 1.2875 | ||
| Ratio | Male | 218 | 1.0605 ± 0.14052 | <0.001 |
| Female | 92 | 1.0921 ± 0.17681 |
Table 7: Lateral and medial tibial slope and differential ratio comparing males and females.
Discussion
Medial and lateral tibial slope assessments in individuals with ACL injuries have significantly increased in our sample population of 310 participants. Both the medial and lateral tibial slopes increase the risk of ACL damage and re-injury as separate metrics. Taking into account the three-dimensional tibial morphology, the asymmetric distal femoral morphology and the concave medial and convex lateral tibial slopes result in intricate multidirectional bone movements that induce anterior tibial translation [5,6]. The rising strain over the ACL may be caused by the dynamic variation in the posterior tibial slope with rotatory movements of the tibia, especially internal rotation.
The normative values for medial and lateral tibial slope have already been defined in literature. In our study population (Indian population), there is a significant increase in posterior tibial slope in males when comparing both the sexes. This is contrary to published literature wherein females have an increased posterior tibial slope as compared to males. This may be due to the ethnic cohort variance in the Indian population or can be due to a low sample size of the female population.
From birth until skeletal maturity, the tibial slope steadily decreases, starting at about 25 degrees. Increased anterior tibial translation and consequently higher torsional forces surrounding the anterior cruciate ligament can be caused by an increase in the posterior tibial slope. A variety of factors, including the proximal tibial and distal femoral morphology, hormone levels, ligamentous laxity, quadriceps strength, and axial loading force over the joint, contribute to the force transferred through the loaded ACL [7].
Recent research on the use of osteotomy to alter the posterior tibial slope in order to avoid re-injuries in people with ACL injuries has shown encouraging short-term outcomes.
For every 10 degrees of slope increase, there should be a 6 mm anterior tibial translation, which increases the stresses on the ACL (11). More specifically, the risk of an ACL damage increases by 39% for every degree that the posterior tibial slope increases.
In our study population, males suffered greater injuries than females. The ACL damage group in our study population had a significantly higher medial and lateral tibial slope, which is consistent with recent research [8]. The study's first reported value, the differential tibial slope ratio, indicates a statistically significant trend (P value<0.001) toward a higher incidence of ACL injury. However, it was discovered that the ACL-injured group had a more markedly elevated medial, lateral, and differential tibial slope. In patients with a recurrent ACL injury and an elevated posterior tibial slope, proximal anterior tibial wedge osteotomy involving both condyles have been used [9]. Given that the lateral tibial slope was the most important predictor of ACL injury, would isolated lateral condyle slope correction be more accurate?
Using radiographs to measure the slope would be inaccurate as it measures the concave medial tibial slope and accurate MRI slope measurements may be more accurate before slope correction. The effect of menisci on the effective slope is still unclear. Slope correction without taking menisci and each tibial condyle slope into consideration may be detrimental.
Conclusion
In the Indian population, ACL injury was significantly predicted by the lateral posterior tibial slope, medial posterior tibial slope, and differential tibial slope ratio. The difference slope ratio was the least significant, whereas the lateral tibial slope was the highest.
References
- Zeng C, Cheng L, Wei J, Gao S, Yang T, et al. (2014) The influence of the tibial plateau slopes on injury of the anterior cruciate ligament: a meta-analysis. Knee Surg Sports Traumatol Arthrosc 22:53-65
[Crossref] [Google Scholar] [PubMed]
- Claes S, Vereecke E, Maes M, Victor J, Verdonk P, et al. (2013) Anatomy of the anterolateral ligament of the knee. J Anat 223:321-328
[Crossref] [Google Scholar] [PubMed]
- Griffin LY, Agel J, Albohm MJ (2000) Noncontact anterior cruciate ligament injuries: risk factors and prevention strategies. J Am Acad Orthop Surg 8:141-150
[Crossref] [Google Scholar] [PubMed]
- Brandon ML, Haynes PT, Bonamo JR (2006) The association between posterior-inferior tibial slope and anterior cruciate ligament insufficiency. Arthroscopy 22:894-899
[Crossref] [Google Scholar] [PubMed]
- Hashemi J, Chandrashekar N, Gill B (2008) The geometry of the tibial plateau and its influence on the biomechanics of the tibiofemoral joint. J Bone Joint Surg Am 90:2724-2734
[Crossref] [Google Scholar] [PubMed]
- Posthumus M, Collins M, September AV, Schwellnus MP (2011) The intrinsic risk factors for ACL ruptures: an evidence-based review. PhysSportsmed 39:62-73
[Crossref] [Google Scholar] [PubMed]
- Hewett TE (2000) Neuromuscular and hormonal factors associated with knee injuries in female athletes: strategies for intervention. Sports Med 29:313-327
[Crossref] [Google Scholar] [PubMed]
- Hewett TE, Myer GD, Ford KR (2005) Biomechanical measures of neuromuscular control and valgus loading of the knee predict anterior cruciate ligament injury risk in female athletes: a prospective study. Am J Sports Med 33:492-501
[Crossref] [Google Scholar] [PubMed]
- Myer GD, Ford KR, Hewett TE (2005) The effects of gender on quadriceps muscle activation strategies during a manoeuvre that mimics a high ACL injury risk position. J Electromyogr Kinesiol 15:181-189
[Crossref] [Google Scholar] [PubMed]
Open Access Journals
- Aquaculture & Veterinary Science
- Chemistry & Chemical Sciences
- Clinical Sciences
- Engineering
- General Science
- Genetics & Molecular Biology
- Health Care & Nursing
- Immunology & Microbiology
- Materials Science
- Mathematics & Physics
- Medical Sciences
- Neurology & Psychiatry
- Oncology & Cancer Science
- Pharmaceutical Sciences